Silver Tightens Its Grip: Record Inventories, Backwardation, and the Battle Between Paper and Physical
 Copy link
For a metal that rarely makes headlines, silver is having its moment again — quietly, decisively, and in ways that could reshape the global precious metals market for years to come.
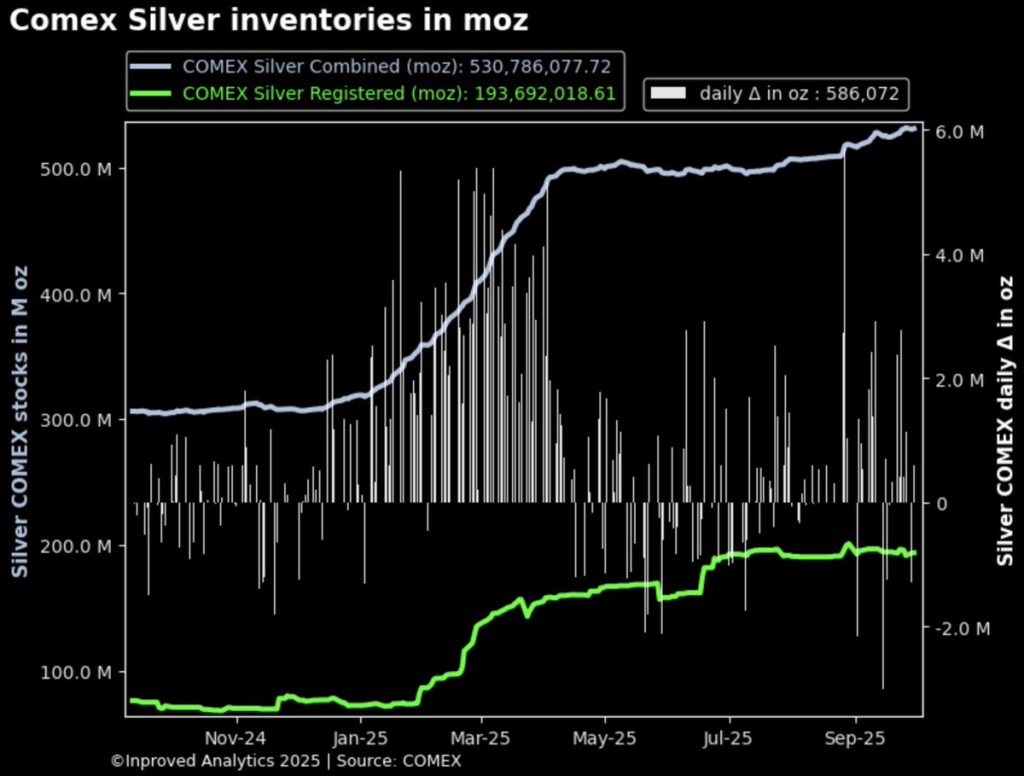
On Thursday, COMEX inventories reached an all-time high of 531.9 million ounces, up another 1.4 million ounces (+43.6 tons) from the previous day. That’s a 66.8% increase year-to-date in total holdings, and an astonishing 163% surge in the registered category — the portion of the stock available for immediate delivery.
Yet beneath this veneer of abundance, the physical market is flashing signs of stress.
Lease rates have spiked to 7.3% — the highest in more than a decade — and the silver futures curve has just flipped into backwardation, a rare signal that near-term demand for metal outstrips future supply.
It’s a contradiction that defines this market cycle: full vaults but tight hands.
When inventories rise to record highs, logic suggests oversupply. But silver, as Hugo Pascal explains, rarely plays by textbook economics.
“Silver inventories are like hotel rooms,” he writes. “You can see them on paper, but they’re fully booked. You just don’t know it yet.”
Indeed, most of the COMEX build-up reflects allocated metal — metal technically in the system but already spoken for by ETFs, industrial end-users, or bullion banks hedging physical exposure. That’s why, even with 531.9 million ounces in storage, the 1-month lease rate has soared to 7.3%, signaling severe near-term scarcity.
It’s a reminder of what happened in late 2020, when vault stocks swelled even as available ounces dried up. Silver lease rates at the time touched 6.8%, and within two months, the spot price had surged from $25 to $30 per ounce.
This week, silver futures slipped into backwardation — a condition where spot prices exceed futures prices.
The December 2025 contract is now trading $0.05 cheaper than spot ($47.62 vs. $47.67). While that might seem minor, it’s a structural anomaly in a metal usually dominated by contango, where futures are costlier due to storage and financing costs.
Backwardation is the market’s way of saying: “I want silver now, not later.”
Historically, silver backwardation has been a precursor to major rallies. It appeared briefly before the 2011 silver spike, when prices hit $49.80 per ounce, and again during the 2020 COVID supply dislocation, which pushed prices up 40% in 60 days. The mechanism is simple: when near-term metal is scarce, traders pay up to secure immediate delivery, forcing short sellers to scramble for physical supply.
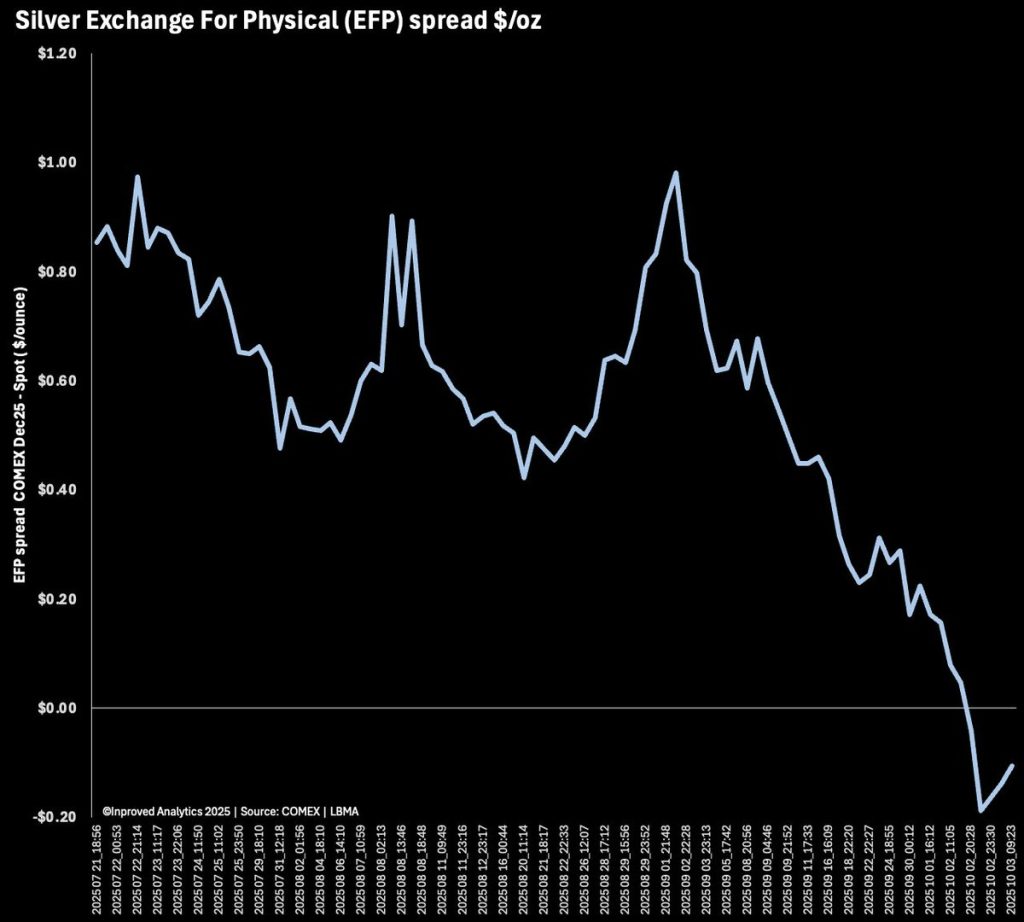
That squeeze dynamic may already be underway. The EFP (Exchange for Physical) spread — a measure of the price differential between futures and spot markets — has shrunk to just 0.156 cents per ounce, down from 64 cents two weeks ago. A tightening EFP often coincides with vault outflows or delivery stress, suggesting demand for conversion from paper to metal is accelerating.
Adding to the momentum, UBS raised its silver forecasts again, projecting $52 per ounce in 2025 and $55 by mid-2026. The bank cited both structural underinvestment in new mine supply and surging industrial demand, particularly from photovoltaics and electric vehicles.
Global silver mine output is expected to grow just 1% this year, according to the Silver Institute, while industrial use — led by solar panel production in China and India — is set to rise 9%. That gap matters: the world consumes about 1.1 billion ounces of silver annually, but primary mine output is only 830 million. The rest must come from recycling or existing inventories, both of which are finite.
UBS’s note echoes the logic of 2010–2011, when the last major supply-demand imbalance pushed silver to its modern peak. Then, as now, lease rates spiked, EFPs collapsed, and the futures curve inverted — all early warnings that the paper market was underestimating real-world scarcity.
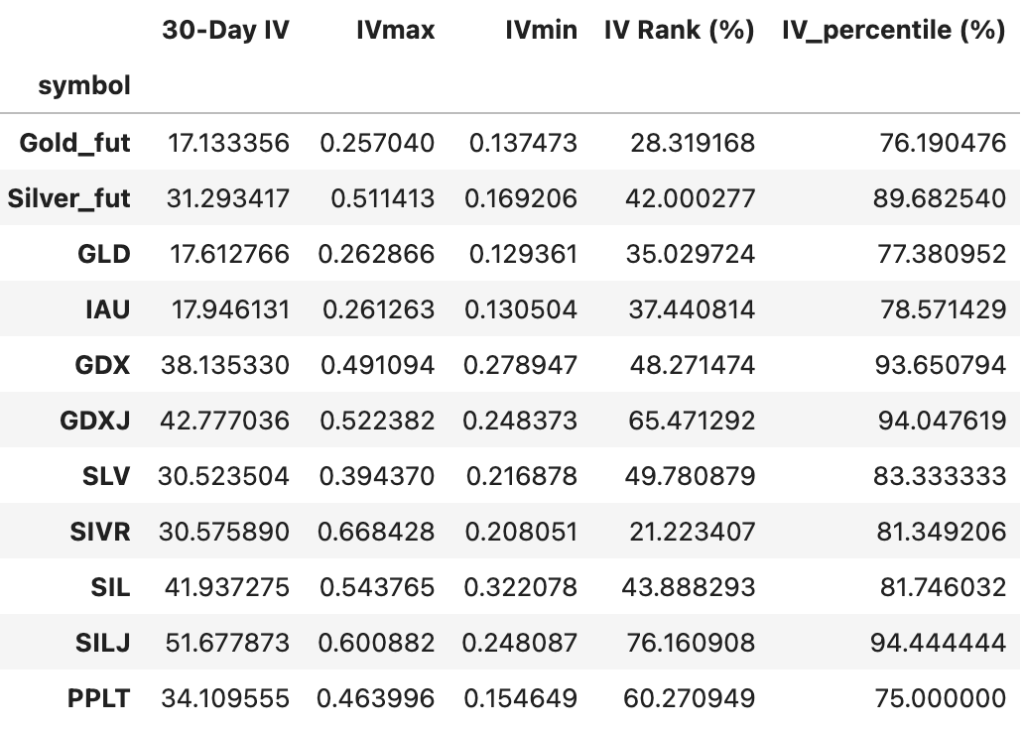
The options data adds another layer to the story. The 30-day implied volatility (IV) for Silver Futures (31.3%) and the SLV ETF (30.5%) now sits near their 12-month highs, with IV percentile readings above 83%. That means current volatility is higher than 83% of all readings in the past year — a clear signal of elevated speculative activity and hedging demand.
Among miners, the GDXJ (junior miners ETF) has the most explosive setup, with IV rank above 65% and IV percentile at 94%, reflecting traders’ expectation of amplified moves in smaller-cap producers — typically the first beneficiaries of a sustained rally.
Pascal interprets this as “volatility repricing, not panic.”
“Volatility is the price of opportunity,” he notes. “When silver’s implied volatility climbs while backwardation sets in, it’s telling you capital is positioning for scarcity. It’s the paper market bracing for physical reality.”
The current structure bears an uncanny resemblance to two past silver squeezes.
In 1998, Warren Buffett’s Berkshire Hathaway famously accumulated 129.7 million ounces of silver, quietly absorbing supply during a period of backwardation. The move triggered a year-long rally of nearly 60%.
In 2011, a confluence of record ETF inflows and tight lease markets sent silver soaring from $26 to $49 per ounce in less than eight months. Backwardation reappeared briefly before the peak, and the COMEX registered category — much smaller than today — dropped by half in six weeks.
This time, the setup is reversed in appearance but similar in essence. COMEX stocks are ballooning, not shrinking, yet so much of it is “spoken for” that the available float is effectively tighter than it looks. With ETF holdings up 2.07% month-on-month (+421 tonnes) and the LBMA’s free float hovering near record lows, the so-called glut may already be an illusion.
The futures-to-registered ratio at COMEX stands at 4.2, meaning there are 4.2 ounces of open paper claims for every deliverable ounce in registered vaults. Even using the broader “combined” category, the ratio remains a stretched 1.55x. Both figures underscore the same point: leverage in the paper market is running far ahead of available physical.
This is not new, but it’s becoming harder to ignore. In past cycles, when the ratio breached 4x, volatility followed — typically favoring physical buyers.
Pascal summarizes it succinctly: “Every ounce that’s bought and not delivered becomes a promise. And promises are easy to print — until someone asks to see the metal.”
UBS’s forecast revision is not just a headline — it’s a cue. Institutional revisions tend to attract both ETF inflows and options hedging. Already, SLV’s daily options turnover has doubled since mid-September, and its implied volatility percentile (83%) suggests traders expect more movement ahead.
Meanwhile, smaller funds like SIVR and WisdomTree’s PHAG/PHSP — despite accounting issues with bar list consistency — are also seeing inflows, totaling over 44.5 tons of metal equivalent last month. The inconsistencies, while minor in magnitude, highlight a growing issue in silver: paper representation is expanding faster than metal verification.
That’s why physical premiums remain firm in Asia — around +$1.40/oz, or 3.3% above LBMA — even as global inventories sit near records. It’s the same paradox gold faced in 2020: plenty of metal, not enough movable metal.
For long-term investors, silver’s current structure is not noise — it’s a signal.
1. Backwardation = Urgency. When spot trades above futures, it’s the market telling you that holding metal today is more valuable than a promise tomorrow. Historically, backwardation in silver has preceded 20–50% rallies within 6–9 months.
2. Lease Rate Spike = Real Scarcity. A 7.3% lease rate means large holders are unwilling to lend metal without significant compensation. That scarcity premium tends to persist until new supply enters the system — which, given mining constraints, won’t happen quickly.
3. Volatility = Opportunity, Not Risk. With IV rank in the 80s–90s percentile range across silver ETFs, options are signaling big moves ahead. For conservative investors, that’s a cue to hold physical and let speculators absorb the noise.
4. Watch the EFP. As the EFP shrinks, it indicates tightening between paper and physical markets — a hallmark of stress. If it inverts (goes negative), delivery pressure could intensify sharply.
For professionals, retirees, and civil servants — investors who prioritize capital preservation — silver can seem too volatile to touch. Yet, it’s precisely these inflection points that reward disciplined positioning.
Here’s a framework:
As Pascal writes, “Silver rewards conviction but punishes impatience. It’s a marathon asset in a sprinting world.”
The last time lease rates exceeded 7% (1979–1980), the Hunt brothers’ accumulation triggered a global supply panic. Prices quadrupled within months, and backwardation persisted for 11 consecutive weeks.
In 2020, the surge in EFPs and logistical bottlenecks during the pandemic forced refiners to airlift metal across continents. Silver spiked 45% as COMEX introduced emergency settlement mechanisms.
Today’s environment combines elements of both — a macro tightening cycle winding down, industrial demand surging, and financial markets showing signs of re-leveraging. The difference this time? The metal is far more global, and the data far more transparent.
That transparency cuts both ways. It means the buildup to a squeeze can be seen coming — but it also means few will act early enough.
Silver’s story in 2025 is one of paradoxes: record inventories alongside record scarcity, shrinking EFPs amid swelling vaults, and rising volatility without fear. The market isn’t breaking — it’s repricing the cost of real metal in a world addicted to derivatives.
UBS’s $55 forecast may soon look conservative. The forward curve, lease rates, and volatility metrics all point in one direction: higher real-world value for deliverable ounces.
For conservative investors, this isn’t a call to speculate — it’s a call to prepare. In a market where every ounce has multiple claimants, ownership is the only certainty worth paying for.
As Pascal concludes, “Gold is trust. Silver is proof. And proof is running out.”
Singapore remains one of the world’s most efficient jurisdictions to buy, store, and insure physical bullion — tax-free and fully transparent. Visit InProved.com today to access some of the lowest LBMA-linked silver prices and secure your place before the next squeeze begins.
Hugo Pascal’s observation about the AU9999 contract hitting a 10-week volume high underscores the increasing significance of physical gold trading on the Shanghai Gold Exchange. This trend not only highlights robust domestic demand in China but also reflects broader shifts in the global gold market toward physical-backed assets.
Latest articles
Tool and strategies modern teams need to help their companies grow.
Invite users to stay updated with exclusive insights and market trends by subscribing to the newsletter.
Start stacking your bullion. Download the InProved app and build your legacy in gold and silver.


InProved Pte. Ltd. (“InProved”, UEN 201602269C). InProved is regulated by the Ministry of Law (“Minlaw”) and holds a Precious Stones and Precious Metals license for dealing in bullion products (PSPM License PS20190001819). For additional legal and privacy related information related to InProved, please visit are terms and conditions.
Our products and services are only available to Accredited Investors. Investing in bullion involves risk, and there is always the potential of losing money. Certain bullion products are not suitable for all investors. The rate of return on investments can vary widely over time, especially for long-term investments. Past performance is no guarantee of future results. Before investing, consider your investment objectives and any fees and expenses that may be charged by InProved and any third-party stakeholders. The content provided herein is for informational purposes only and is not investment or financial advice, tax or legal advice, an offer, solicitation of an offer, or advice to buy or sell or hold bullion products. This material has not been reviewed by the Minlaw.
Statements made are not facts, including statements regarding trends, market conditions and the experience or expertise of the author or quoted individual(s) are based on current expectations, estimates, opinions and/or beliefs. Opinions expressed by other members on InProved should not be viewed as investment recommendations from InProved. Endorsements were provided at the request of InProved. InProved is not affiliated with and does not purport to own or control any third-party content linked herein.
Copyright © 2026 InProved Pte Ltd (UEN 201616594C, PSPM license PS20190001819)


 +65 8899 3720
 support@inproved.com
